作者:雅思写作组张雨薇
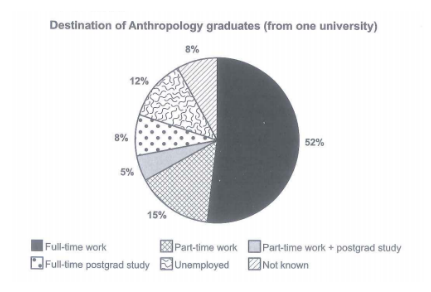
静态图就是进行数据大小比较,找出最 大/第二大/最小/倍数/比较级/相同相似关系-这是大多数学生对数据分析的理解,殊不知单纯机械式罗列数据会让自己的文章读起来像记流水账一样,最后考官评分在5.5-6 ,很难取得高分。 我们以C15T4T1组合图中的图一饼图为例来看看大多数学生的写法。

大多数学生最后呈现出的版本是“full-time work比例最 大,part-time work和unemployed 比重相似,full-time postgraduate study 和not known 数据相同,part-time work + postgraduate study 数据最小”,这种写法只是单纯交代了数据之间的关系,并未提炼出数据所反映的有意义信息。 另外评分标准 TA/CC7分维度有这样的要求:clearly presents and highlights key features / bullet points (主要特征)but could be more fully extended (充分数据支撑);there is clear progression throughout: logically organises information and ideas; (有逻辑组织信息)。接下来,笔者带大家分析分析这类题型更有意义的写法。
这道题是关于毕业生就业去向调查,所给的6个项目中部分项目存在性质上的联系,有两种归类方式:一种是full-time一类/part-time一类;另一种是work一类/postgraduate study一类。笔者更倾向于选择工作类和学习类,所以本题信息描述先后为:工作(Full-time work 52% & Part-time work 15%)学习(Full-time postgraduate study 8% & Part-time work + postgraduate study 5%)不重要信息(Unemployed 12% Not known 8%),从整合出的数据(工作-67% 学习-13%)来看,工作应该是大多数学生的选择,较少学生选择学习;有了这种显著特征的提炼,我们接下来需要提供足够的数据支撑,相加总数是必须交代的数据,但只提供总数读者不能推出具体项目的数据,我们还需要从具体项目中选择更有意义的数据进行说明,无疑全职工作(最 大)和半工半读(最小)是更有特色数据。以下句型及写作样本可供大家参考:
整合项特征描述, accounting for # collectively, with… 拆分项-呈现更有意义数据
The percentage of 整合项目 was much lower/smaller/higher/larger, reaching #, especially that of 拆分项-呈现更有意义数据
Sample answer
Working was the main choice for graduates, accounting for 67% collectively, with 52% of them working full time. 【工作类先整后拆】 By contrast, the percentage of students furthering their studies was significantly smaller, reaching 13%, especially that of students continuing postgraduate study with part-time jobs (5%). 【学习类先整后拆】 12% of graduates were unemployed, and the information about all the rest graduates was unknown.
这种写法既包含了主要特征及足够数据支撑,并且整体信息呈现更有逻辑,符合TA/CC高分模式,我们再结合一道题加强理解。
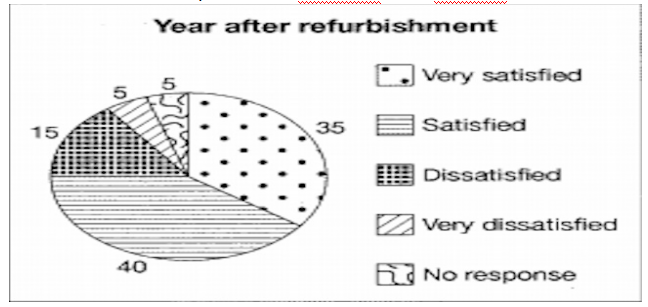
Results of surveys of visitors satisfation about Ashdown museum

Step 1: 归类
positive feedback-very satisfied + satisfied
negative feedback – dissatisfied + very dissatisfied
no response
Step 2: 提炼总数及更重要数据
positive feedback-75% very satisfied-35% (程度更深)
negative feedback-20% very dissatisfied-5%(程度更深并且是最小值)
Step3: 组织成句
Positive feedback was the main option of visitors, accounting for 75% collectively, with 35% of them very satisfied with Ashdown museum. By contrast, the percentage of tourists with negative feedback was much lower, reaching 20%, especially that of visitors who were very dissatisfied with this museum (5%).The remaining 5% of visitors gave no response.
以上方法适用于解决项目具有联系类静态图数据分析问题,后期碰到类似考题可以参考应用,雅思写作解题思路及表达不唯 一,大家在平时学习中注重积累思考,提升个人灵活应对能力!